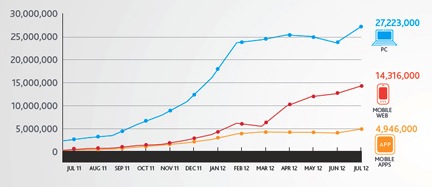
Nielsen’s annual Social Media Report is in, and from it we can gather some very interesting facts about Social Marketing trends from his past year. Diving right into the statistics laid out in their pleasing infographics we can see that mobile apps are taking a step towards the front, with users increasing their app usages by 76% when compared to last year’s numbers. Computer-based usage is still heaviest, though – likely attributed to how very buggy those apps can be.
As for the top Social Networks, unsurprisingly Facebook took the lead by far in terms of unique visitors on personal computers. More surprising is that Blogger came in second, with Twitter and WordPress not far behind. Following them were Linkedin, Pinterest, Google+, Tumblr, Myspace, and Wikia – in that order. Twitter, WordPress, Google+, Tumblr, and Wikia all saw positive growth in users, with Pinterest seeing a 1,047% increase [Source]. For this reason Nielsen chose to spotlight Pinterest in their review.
Pinterest is fast becoming a Social Media powerhouse, having seen sharp increases in usage in just this past year alone [Source]. While the Pinterest audience is heavily split with far more females than males using their service, the median age of use is early 20’s to mid 30’s and predominately white by race. Because of these statistics marketers have a very specific audience on Pinterest which they can tap into, and with a very high total for minutes spent on the website they’ve got an excellent attention span to grab hold of.
Nielsen made sure to point out that Twitter is taking a lead role in mixing Social Media with television. More and more users are watching TV while using their mobile devices to access their favorite programs, commenting and discussing these shows on Twitter with friends and family. The number of users Tweeting about television grew almost steadily month to month, from 26% in January 2012 to 33% in June 2012 [Source].
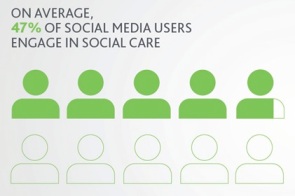
Advertising and Social Media customer service from online companies saw interesting numbers this year, too. According to Nielson 47% of Social Networking users tapped into the Social Care offered by websites, and one in every three users preferred to contact companies this way instead of by phone [Source]. Although 33% of  Social Media users found Social Networking advertisements to be more annoying than others, over a quarter of users will still pay attention to them – especially on Facebook. Nielsen found that ‘Social Likes’ and shared ads greatly increase brands’ visibilities online. What are consumers using brand and company pages for? 70% of consumers listen to the experiences of others on Social Sharing sites, 65% use the sites for learning more about brands, products, and services, and 53% compliment the brands. Half of users complain or leave comments of concern, while 47% discuss monetary incentives [Source].
Some more interesting facts came up in Nielsen’s report that are definitely worth taking note of. While personal computers lead for how users are connecting to Social Media sites, mobile phones, tablets, and other handheld devices follow suit. In terms of why people connect with others through these sites, the most popular reasons simply come down to knowing their fellow users in real life and wanting to keep in touch with them. Where are they connecting most? Humorously, young adults aged 18 to 24 are using Social Media in the bathroom, while adults aged 25 to 34 are mainly using it in the office [Source]. Finally, 76% of users had an overall positive experience using Social Networking sites this past year, which is what we Social Media gurus love to hear!
In summary, personal computers still reign and Facebook is the King of Social Networking all around, but smaller underdog sites and mobile apps are certainly beginning their climb to the top. Compared to the numbers Nielsen reported in 2011, these statistics are not straying from the overall trend that we’ve been seeing for Social Media. It will continue to grow year by year and become the ultimate resource for consumerism, advertising, and media networking.
All images and statistics taken from Nielsen’s 2012 Social Media Report.
